Platform Overview
Platform Overview
The AlgoMesh desktop application is divided into three primary workspaces. Understanding these workspaces is the key to mastering automated trading.
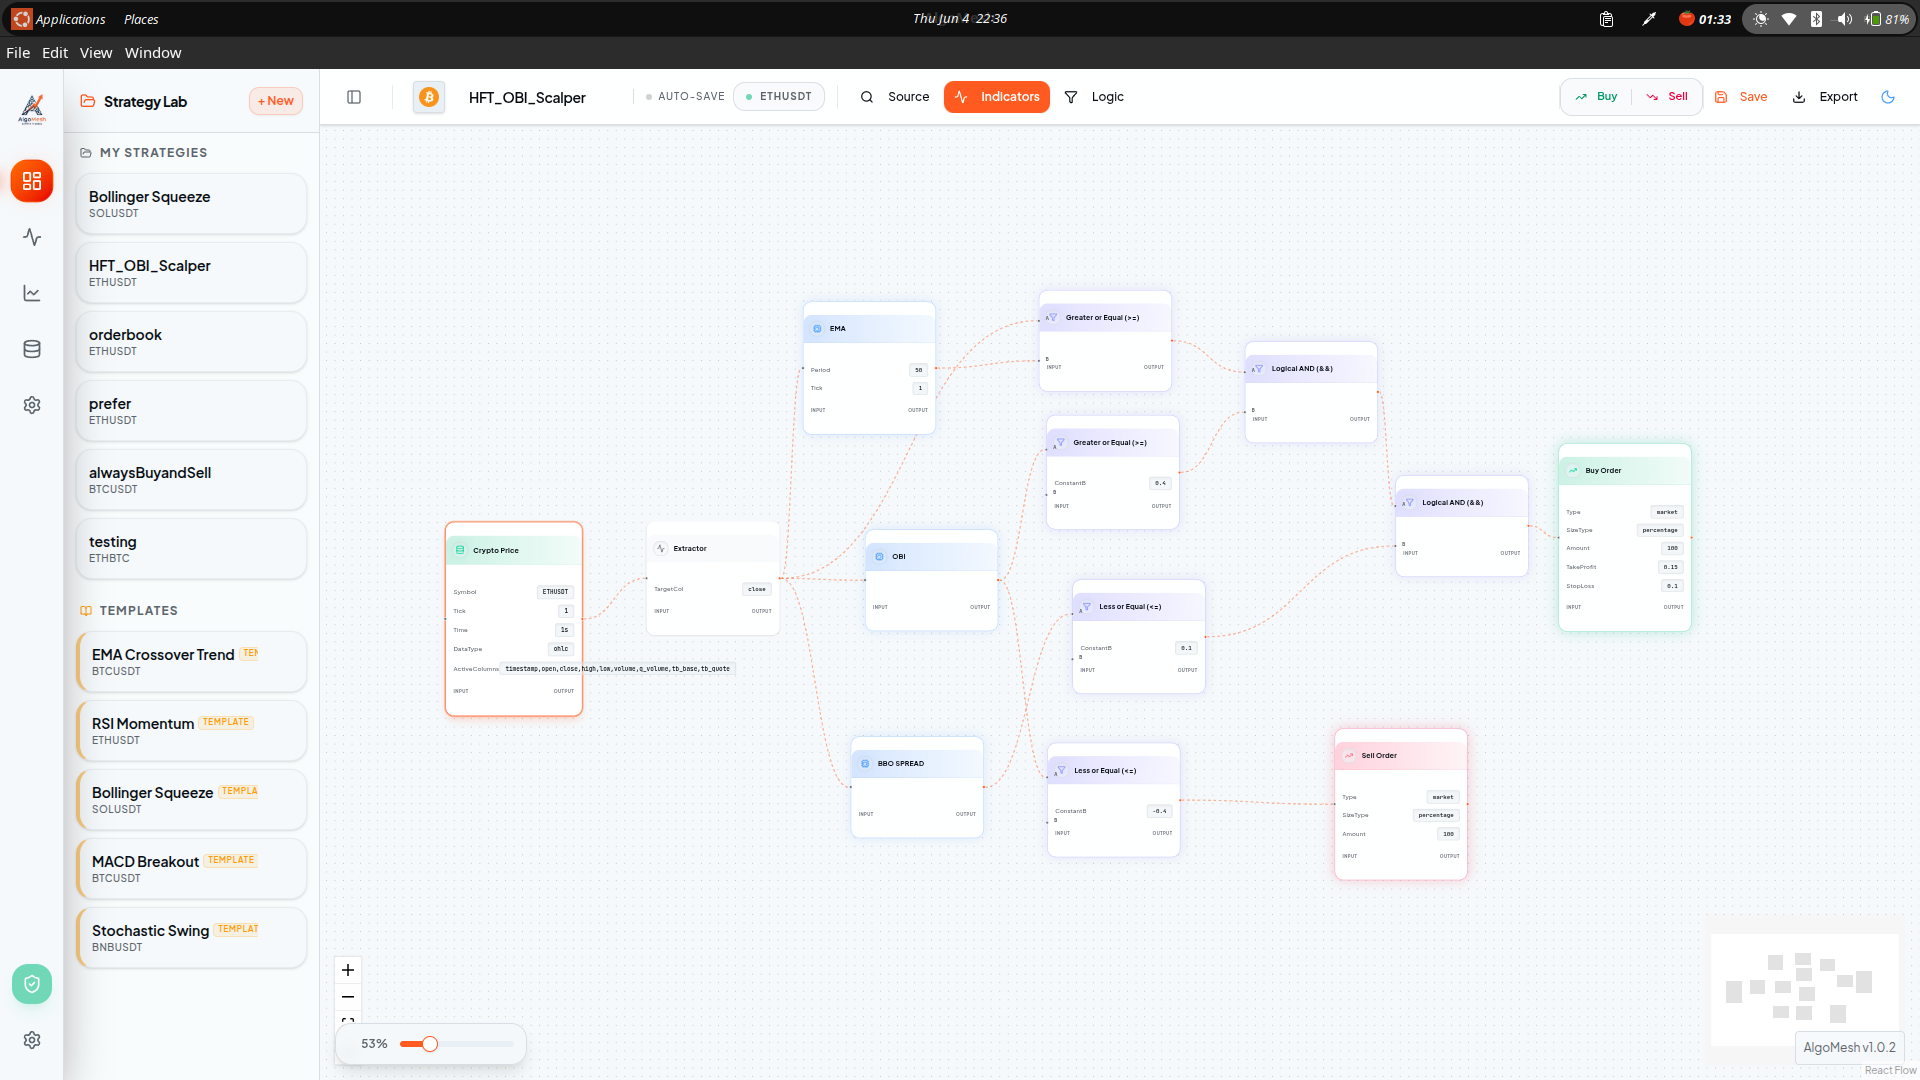
1. The Strategy Builder
This is where you design your logic. The Builder is an infinite visual canvas where you can drag and drop "Nodes". Data flows from left to right. You can combine Price Nodes, Math Operations, Technical Indicators, and Order Execution Nodes to create complex, conditional algorithms without writing a single line of code.
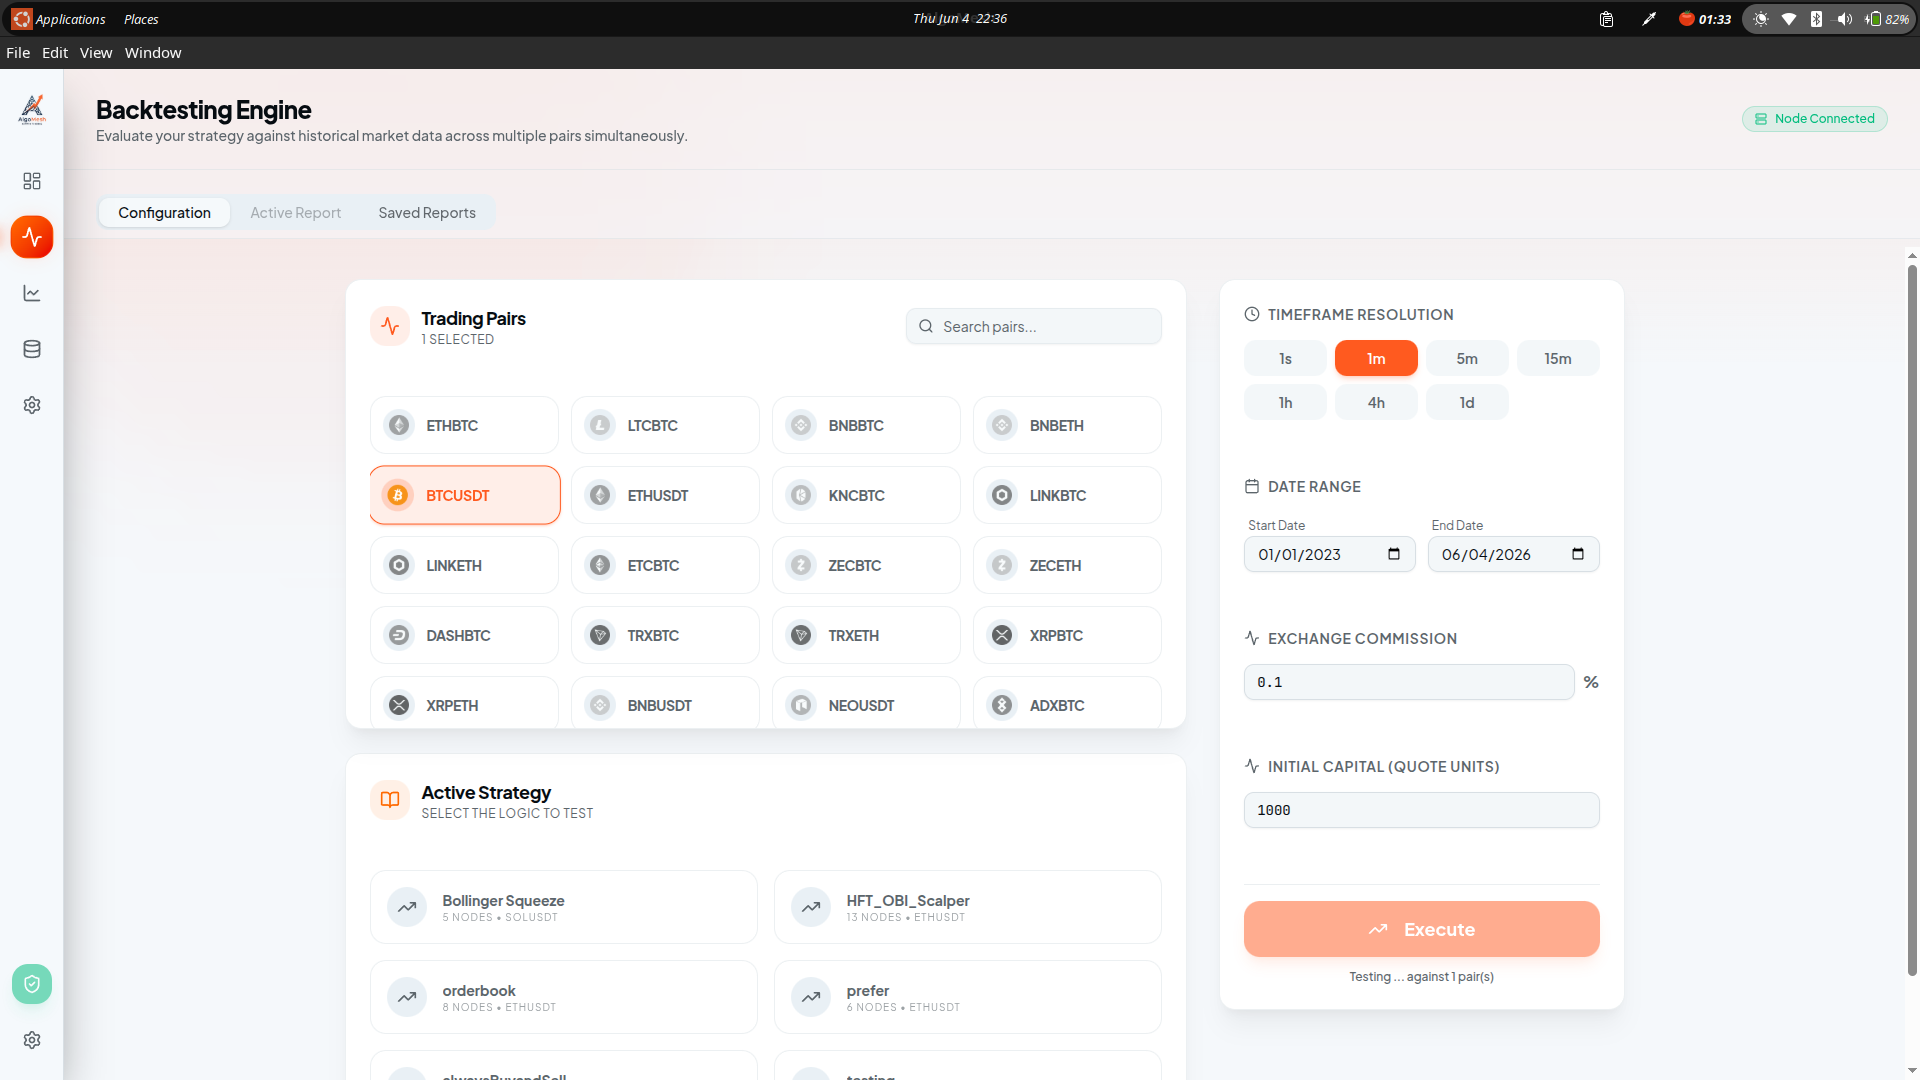
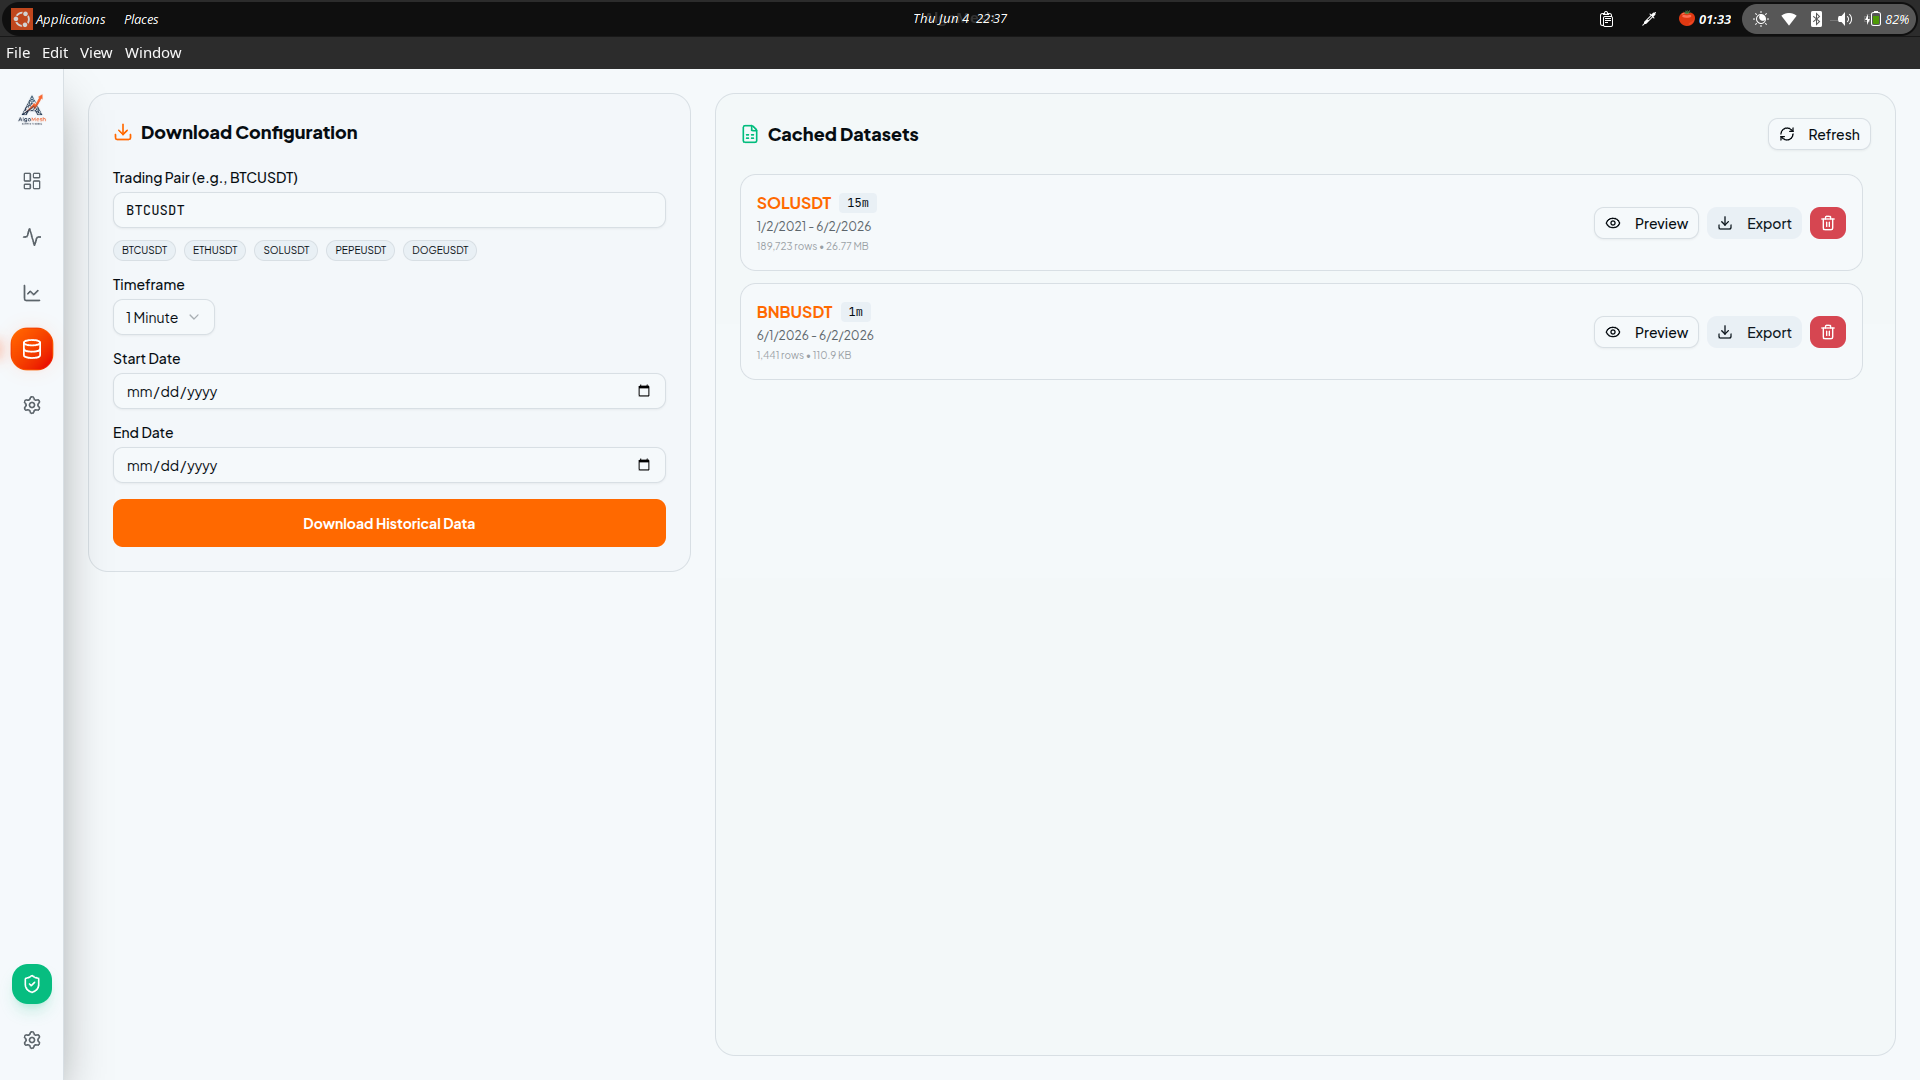
2. The Backtester
Before you ever risk a single dollar in the live markets, you must test your strategy. The Backtesting workspace allows you to run your strategy against months or years of historical market data. It generates an Equity Curve and calculates vital statistics such as Maximum Drawdown, Win Rate, and Profit Factor.
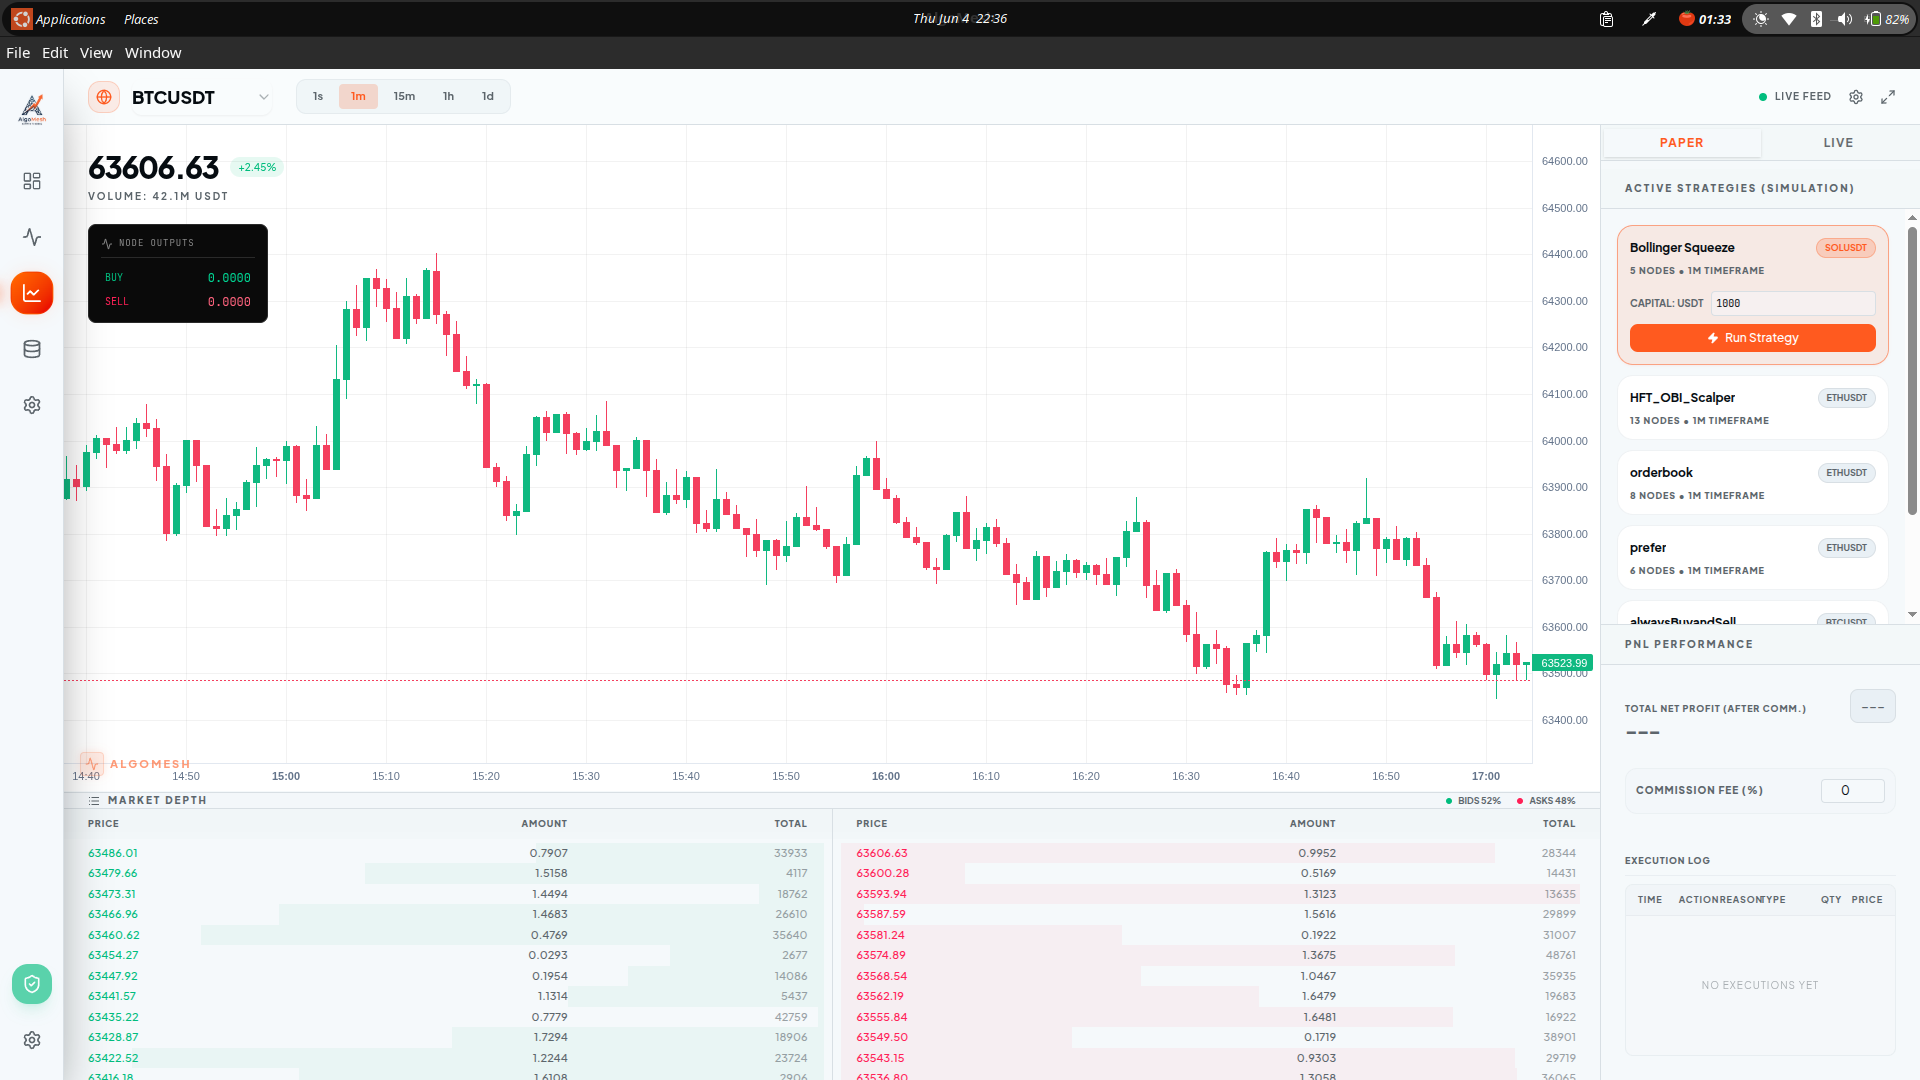
3. The Live Dashboard
Once you are satisfied with your backtesting results, you can deploy the strategy to the Live Dashboard. Here, you can monitor your running algorithms in real-time. You can view ticking PnL, active positions, execution logs, and instantly halt trading using the global Kill Switch.