Visual Strategy Builder
Guides•Last updated on 6/6/2026
Creating a Trading Strategy
The Strategy Builder translates your trading ideas into executable logic through visual nodes. Let's break down how to use it.
The Anatomy of a Strategy
Every strategy requires three components to function:
- Data Source: Where is the information coming from? (e.g., Binance 1m Candles, Live Order Book updates).
- Logic & Indicators: What are the conditions? (e.g., Is the RSI below 30? Has the MACD crossed over?).
- Execution: What should the bot do? (e.g., Place a Market Buy order for 50% of your capital).
Example Workflow
- Drag an Indicator Node onto the canvas (such as RSI) and connect it to your primary price feed.
- Drag a Logic Gate Node and set the operation to
Less Than. - Connect the Indicator's output to
Input A. SetInput Bto a constant value. - Drag a Buy Order Node. Connect the Output of the Logic Gate to the
Triggerinput of the Buy Node.
Real-World Example: Order Book Imbalance Strategy
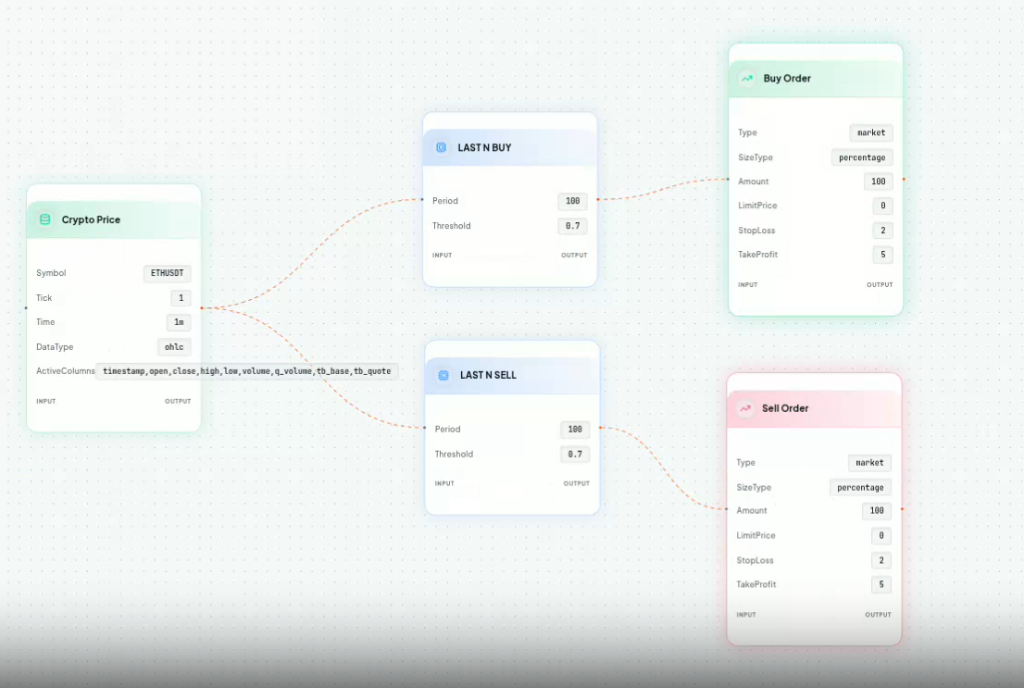
You can build powerful micro-structure algorithms using Order Book depth. For instance, to build a strategy on ETHUSDT that buys when the LAST N BUY ratio exceeds 0.7 and sells when the LAST N SELL ratio exceeds 0.7:
- Add a Crypto Price node set to
ETHUSDT(this acts as the primary data trigger). - Drag a LAST N BUY indicator and a LAST N SELL indicator onto the canvas.
- Configure both indicators with a Period of
100and a Threshold of0.7. - Connect the output of the Price node to the input of both indicators.
- Finally, connect the
LAST N BUYoutput to a Market Buy Order node (Size: 100%), and theLAST N SELLoutput to a Market Sell Order node (Size: 100%).
This simple, visual flow results in an institutional-grade Order Book imbalance strategy that executes instantly on the C++ backend.